How to read your dashboard to know whether your AI is really working
Turning on an AI chatbot is easy. Knowing whether it's adding value or quietly creating problems is another matter. The answer is in your dashboard—if you know what to look at.
Adriana Vallejos
Marketing Analyst & Editor at Helpium
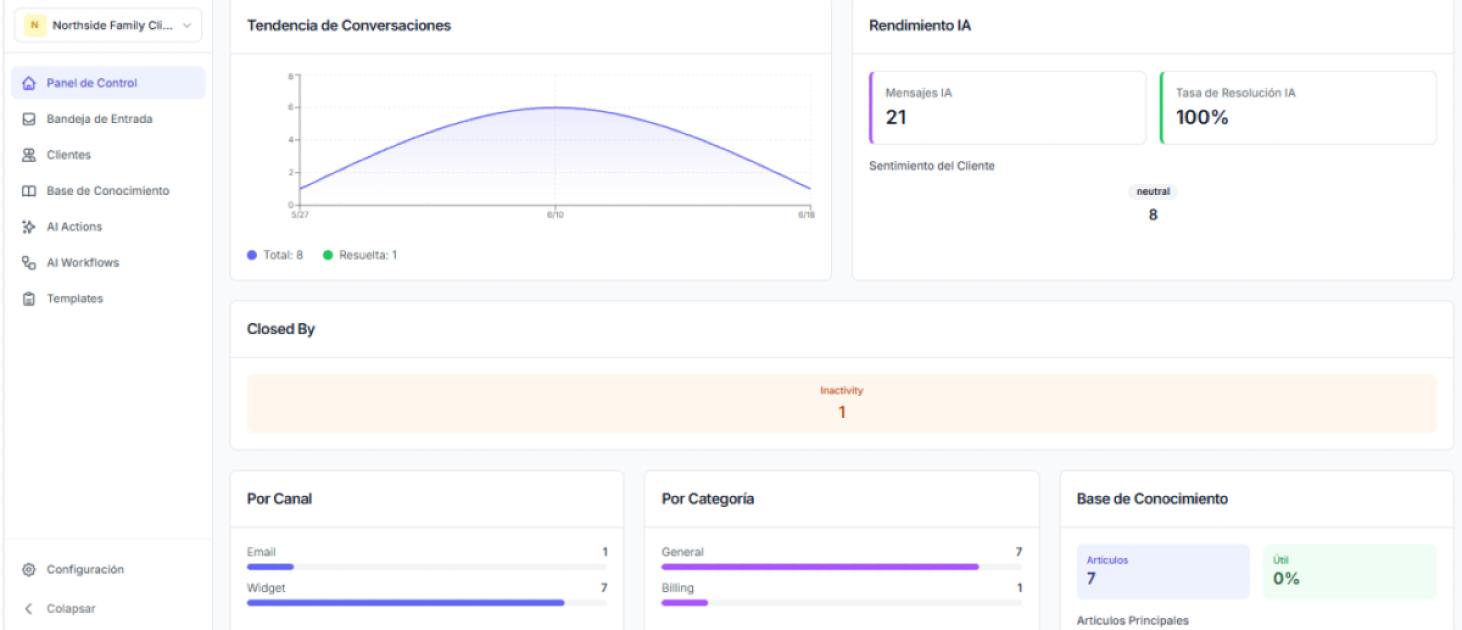
The analytics dashboard exists to answer one specific question: is the AI improving the experience and efficiency, or is it just moving the problem somewhere else? The challenge isn't having data—almost every platform offers it. The challenge is knowing which metrics matter and how to interpret them together, because a single metric on its own almost always lies.
Resolution rate: the most important number, and the most misread
The resolution rate measures what percentage of queries the AI resolves without human intervention. It's the metric that best reflects whether the automation is working. But it's easy to read it wrong.
The right question isn't "what percentage did the AI resolve?" but "what percentage did it resolve well?" A 70% resolution rate with satisfied customers is worth far more than a 90% rate with constant reopenings.
Handoff rate: neither too high nor too low
The handoff rate measures how many conversations the AI passes to a human agent. There's no universal ideal number, but the extremes are warning signs.
A very high handoff rate suggests the AI isn't reaching an optimal level. The causes usually lie in the content: an incomplete or outdated knowledge base, or automation flows that don't cover the common cases. The AI hands off because it has nothing to answer with.
A very low handoff rate, on the other hand, may look ideal but hide a risk: that the system is trying to resolve cases it should escalate, giving poor answers just to avoid handing off.
The healthy number is the one that leaves the repetitive, predictable volume in the AI's hands and routes the complex or sensitive cases to the team. If the rate shifts a lot from one period to the next, it's worth understanding what changed: did a new type of query appear? did a flow break? did some content become outdated?
Response time and resolution time: two different things
It's common to mix up these two metrics, but they measure different things.
First response time is how long the customer waits to receive the first message. With AI, this should tend to be immediate for automated queries.
Resolution time is how long the conversation takes to close effectively. This number includes cases handed off to humans, so it's more revealing about the operation as a whole. A resolution time that stays stable while volume grows is a sign that the system scales well.
Customer satisfaction: the quality control for everything else
All the previous metrics measure efficiency. Customer satisfaction measures whether that efficiency was achieved without sacrificing the user experience.
It's the metric that acts as a counterweight. An operation can have an enviable resolution rate and excellent times, but if satisfaction drops, something is breaking: the AI is probably prioritizing closing quickly over resolving well. Reading satisfaction alongside the rest avoids the mistake of optimizing numbers that look good on the dashboard but feel bad on the customer's side.
How to read it all together
None of these metrics means much on its own. The value lies in how they relate to each other.
High resolution + high satisfaction + low reopenings: the AI is working as it should. It truly resolves.
High resolution + low satisfaction: the system is closing conversations it shouldn't consider closed. You need to review which types of query it's being forced to resolve.
High handoff + low resolution: the AI has nothing to answer with. The problem is almost always in the knowledge base or the flows.
Resolution time rising with volume: the automation isn't scaling and the weight is falling on the human team.
Reading them together turns the dashboard from a screen of numbers into a diagnostic tool. Each combination points to a different cause and, therefore, to a different action.
Conclusion
A dashboard isn't there to make you feel good watching charts go up. It's there to answer honestly whether the AI is delivering the value the company set as its goal.
The key is not to fall in love with a single metric. The resolution rate without satisfaction is deceiving. Handoffs without context are confusing. Read together, though, they give you a clear picture of what's working, what isn't, and where to step in. And that periodic reading, more than any initial setup, is what keeps an AI support operation truly working.
Helpium shows you resolution, handoffs, times and satisfaction in a single dashboard, so you know exactly how your AI is performing. Flat price, unlimited seats.
AI-powered support without AI-powered pricing
Unlimited seats. One flat price. Serve customers with AI and a human team when it matters.
Keep reading
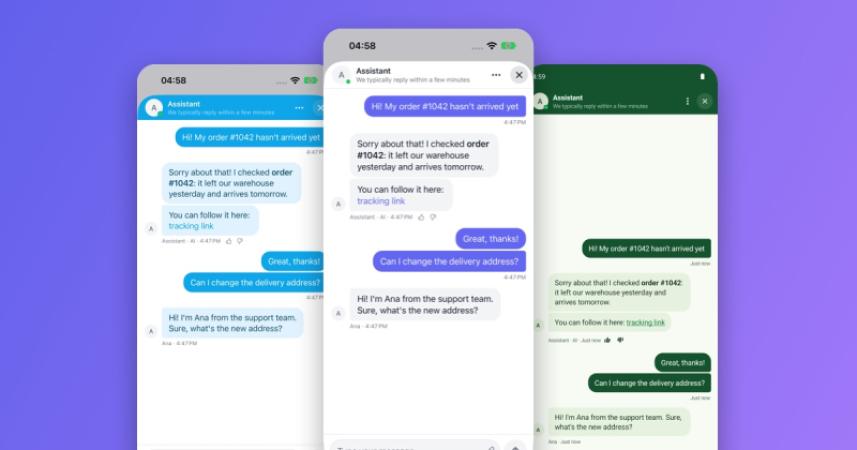
How to add native support chat to your iOS and Android apps
Add a native Helpium chat to your iOS and Android apps in an afternoon: your AI answers instantly, your team takes over when needed, and replies arrive as push notifications.
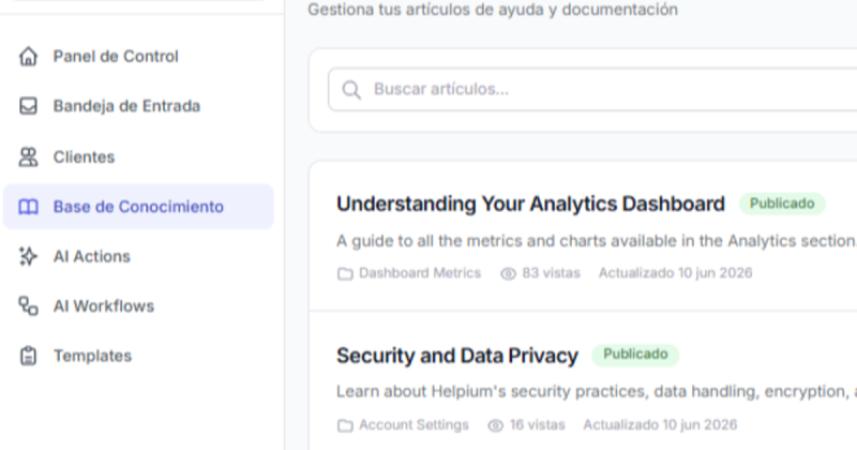
Your knowledge base is the brain of your AI: how to write articles the bot understands
An AI chatbot is never smarter than the content it learns from. If your knowledge base is incomplete or poorly written, it doesn't matter what model sits behind it: the answers will be just as imprecise.